When your file hosting service goes down, your users notice immediately. Uploads fail, downloads stall, and frustration spreads. But chasing every possible metric is a waste of time. You need to focus on the signals that truly predict trouble. Over the years, I have seen teams chase the wrong numbers while real problems slipped through. The seven file hosting uptime metrics covered here will help you spot issues before they become outages. Let us get straight to what matters.
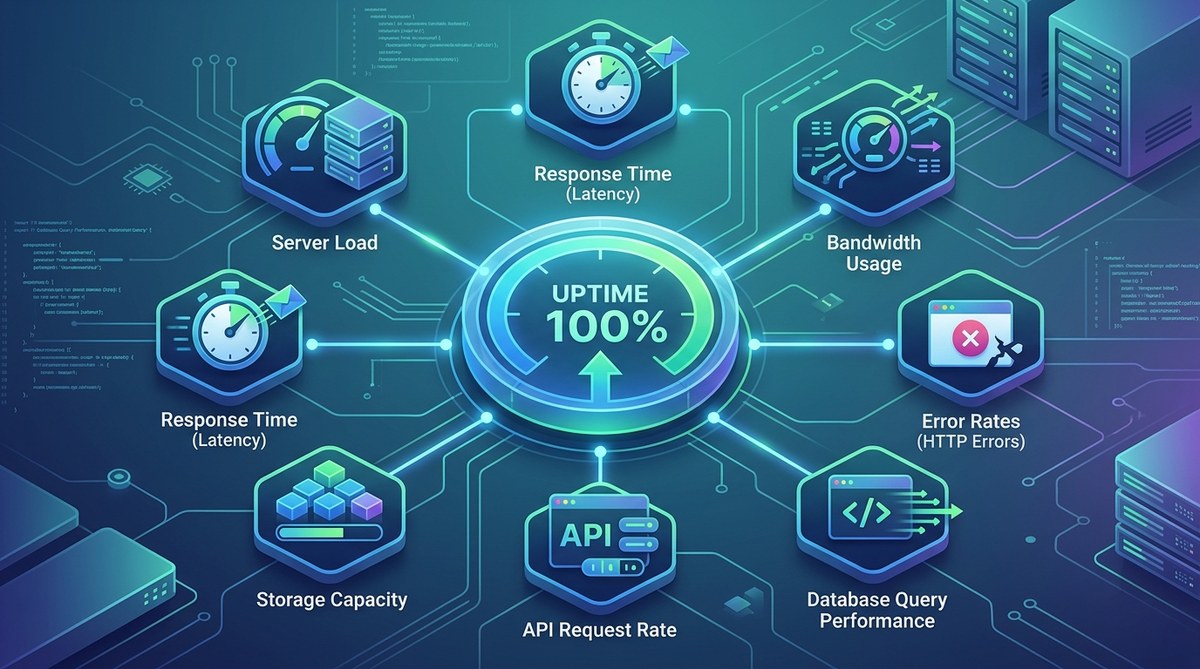
Reliable file hosting depends on tracking the right metrics: availability, response time, error rate, throughput, disk I/O, latency percentile, and resource utilization. Monitoring these seven indicators lets you catch degradation early, prevent downtime, and maintain performance. Without them, you are flying blind in 2026.
Why file hosting uptime metrics deserve your attention
File hosting services are the backbone of many applications. Whether you serve user uploads, software downloads, or media streams, uptime is directly tied to revenue and trust. A five minute outage during peak hours can cost thousands of dollars and damage your reputation. By tracking the correct file hosting uptime metrics, you shift from reactive firefighting to proactive maintenance. You can predict failures, plan capacity, and communicate clearly with your team. Plus, these metrics help you meet service level agreements (SLAs) with confidence.
The 7 essential file hosting uptime metrics
These seven metrics form the foundation of any solid monitoring setup. I have ordered them from the most obvious to the ones that often get overlooked.
-
Uptime percentage (availability) This is the classic metric. Your service should be up a certain percentage of the time. 99.9% uptime sounds great, but it allows nearly nine hours of downtime per year. Depending on your SLA, you may aim for 99.99% or higher. Monitor this from multiple geographic locations to get a truthful picture.
-
Response time (latency) How long does it take for a file request to start returning data? High latency frustrates users and can indicate network congestion, overloaded servers, or slow storage. Track both the average and the tail latencies. The 95th percentile and 99th percentile tell you what your worst experiences are like.
-
Error rate This includes HTTP 5xx errors, failed uploads, and connection timeouts. A sudden spike in error rate often signals an infrastructure issue or a bad deployment. Keep a close eye on this metric, especially after changes to your file hosting backend.
-
Throughput (bytes transferred per second) Throughput measures how much data your service is delivering. If throughput drops while request volume stays the same, something is limiting transfer speed. This could be a network bottleneck, a throttled connection, or a disk that can not keep up.
-
Disk I/O and storage utilization Your file hosting server reads and writes data constantly. High disk latency or full storage can cause partial failures or complete outages. Monitor disk queue length, read/write latency, and available space. Set alerts when space falls below a threshold like 20%.
-
Latency percentile (P95, P99) While response time gives an average, percentile metrics show the experience of your slowest users. If P99 latency creeps up, users with slower connections or farther from your servers will suffer. This metric is critical for global file hosting services.
-
Resource utilization (CPU, memory, network) The health of your underlying server directly affects uptime. If CPU is pegged at 100% or memory is exhausted, file requests will queue up and timeout. Watch these resources over time to spot trends and plan scaling.
Monitoring best practices that save you headaches
Here is a list of practical habits that will make your monitoring more effective:
- Set up synthetic checks from multiple locations to detect regional outages.
- Use a combination of agent based and agentless monitoring for full coverage.
- Define alert thresholds based on percentiles, not just averages.
- Keep historical data for at least 90 days to identify patterns.
- Document your baseline metrics so you know when something is off.
- Automate responses where possible, like restarting a stuck process.
Common monitoring mistakes and how to avoid them
The table below compares typical mistakes with the right approach.
| Mistake | Why it fails | Better practice |
|---|---|---|
| Only monitoring ping checks | Ping shows server is alive but not that file transfers work | Use end to end checks that simulate actual file upload and download |
| Setting static thresholds | Traffic patterns change; a fixed threshold may trigger false alarms | Use dynamic baselines or anomaly detection |
| Ignoring percentiles | Average looks fine but slow users suffer | Track P95 and P99 latency for accurate user experience |
| Not monitoring from outside your network | Internal monitoring misses outages in your ISP or DNS provider | Use external monitoring services with multiple global checkpoints |
| Focusing only on uptime | Uptime does not measure performance like slow downloads | Include response time and throughput in your SLA |
Expert advice on leading indicators
“Most teams monitor lagging indicators like error rates after an outage has already happened. Instead, focus on leading indicators such as disk I/O wait times and connection queue depth. When those metrics trend up, you can act before users feel the impact.”
Sarah Chen, SRE at a large file hosting platform
This shift from reactive to proactive monitoring is what separates good teams from great ones. By watching the right leading indicators, you can schedule maintenance, add capacity, or roll back a change before anyone notices a problem.
Building a monitoring strategy that works
Now that you know the seven file hosting uptime metrics, you need a plan to put them into action. Start by instrumenting your file hosting endpoints with application performance monitoring (APM) tools. Set up dashboards that show all seven metrics in one view. Then configure alerts with appropriate thresholds and notification channels like Slack or PagerDuty.
Do not try to monitor everything at once. Pick the two or three metrics that have caused you the most pain in the past and get those right first. For many teams, that means tracking error rate and latency percentile. Once those are stable, add throughput and disk I/O.
Remember to review your monitoring setup regularly. As your file hosting service grows, the metrics that matter may shift. A small side project can tolerate a few minutes of downtime, but a production system serving thousands of users requires tighter thresholds.
If you are just getting started with file hosting, you might also want to check out our guide on top secure file sharing methods for developers in 2026. It covers authentication, encryption, and access controls that complement your uptime monitoring.
Keep your file hosting reliable with the right metrics
Monitoring file hosting uptime metrics is not a set it and forget it task. It requires ongoing attention, periodic tuning, and a willingness to act on the data. But when you get it right, your service becomes something users can rely on. They upload files without thinking twice. Downloads complete in seconds. And you sleep better knowing that the numbers you watch will warn you before trouble arrives.
Start today by picking one metric you are not currently monitoring. Set up a basic check for it. Then add another next week. Over time, you will build a monitoring culture that keeps your file hosting service running smoothly through 2026 and beyond.