
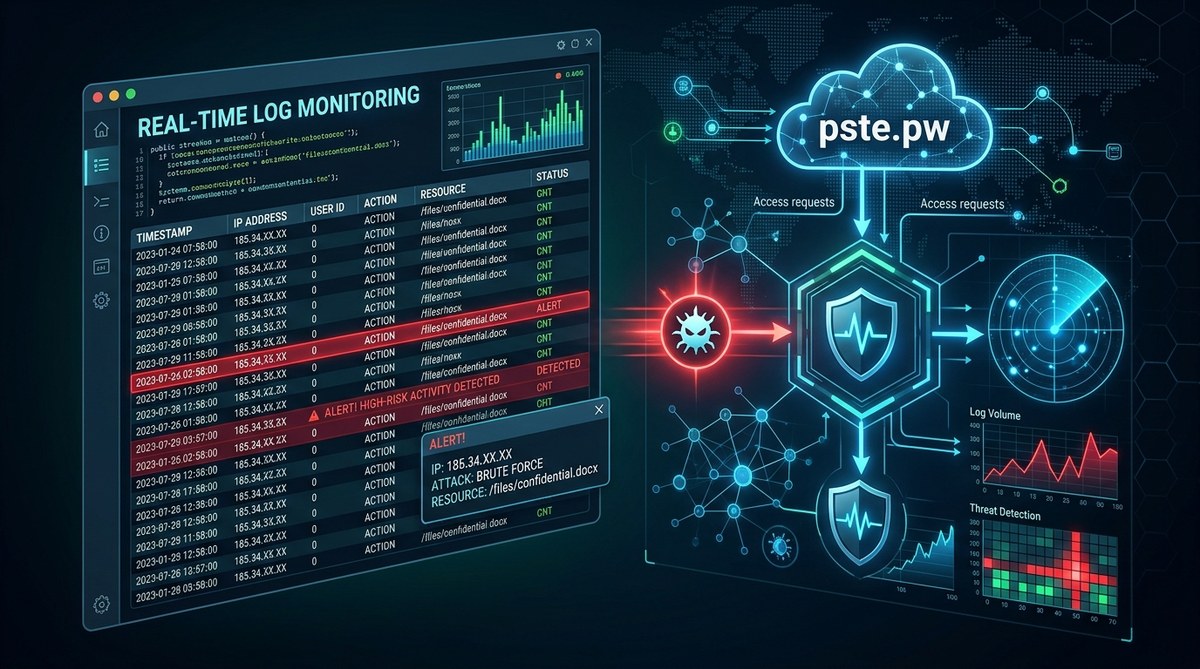
Your file hosting platform is a busy place. Every second, someone uploads a spreadsheet, downloads a PDF, or shares a link to a folder. Each one of those actions leaves a trace in your access logs. For a security analyst or IT administrator, those logs are the first line of defense. They tell you who accessed what, when they did it, and from where. But raw logs are noisy. Without a real-time strategy to filter and analyze them, you might miss the one anomaly that signals a breach. This guide walks you through how to turn those logs into a live security monitoring system.
File hosting access logs are your best tool for catching security threats as they happen. By setting up real-time streaming, defining clear anomaly rules, and automating alerts, you can spot unauthorized access, data exfiltration, and malware activity before they cause real damage. Focus on the four pillars: source IP reputation, unusual file patterns, failed authentication spikes, and geographic anomalies. Build a simple pipeline using your platform’s native tools, and you will reduce response time from hours to seconds.
Why Access Logs Matter for Security
Think of access logs as the security camera footage for your cloud file hosting. Platforms like AWS S3, Google Drive, and Dropbox log every read, write, and delete operation. These logs record the requester’s IP address, user agent, timestamp, file path, and HTTP status code. When you monitor them in real time, you can catch threats that signature-based antivirus tools might miss.
For example, a user who downloads 500 files in two minutes is likely not reviewing them one by one. That is a classic sign of data exfiltration. A source IP from a country where you have no business operations might indicate a compromised credential. And a sudden spike in 403 errors could mean an attacker is probing for misconfigured permissions.
“The difference between a minor incident and a major breach often comes down to how quickly you notice the first anomaly. Access logs are your earliest warning system.” – Anonymous Security Operations Lead
Setting Up Real-Time Log Streaming
Before you can analyze logs, you need to get them flowing in real time. Batch processing (downloading logs once a day) is too slow. By the time you see the alert, the data could already be on a dark web marketplace.
1. Enable logging on your file hosting platform
- AWS S3: Turn on server access logging. Configure the target bucket to receive logs from your source bucket.
- Google Drive: Use the Google Workspace audit log API. Set up a webhook to push events to your SIEM.
- Dropbox: Enable event logging via the Dropbox Business API. Stream events to a centralized log aggregator.
2. Stream logs to a real-time processing engine
- Send logs to a tool like AWS Lambda, Azure Functions, or a self-hosted Apache Kafka instance.
- Parse each log line into structured fields: timestamp, user, IP, file path, action, status code.
3. Apply filtering rules immediately
- Drop routine health checks and internal IPs to reduce noise.
- Flag any log line that contains a known bad IP, a file path matching sensitive data patterns, or a status code of 401 or 403.
Key Threat Patterns to Detect in Real Time
Here are the specific patterns you should build detection rules for. Each one maps to a common attack type.
| Threat Pattern | Log Signature | Action |
|---|---|---|
| Data exfiltration | Single user downloads many files in a short window (e.g., 100+ in 5 minutes) | Block user session and alert SOC |
| Credential stuffing | Multiple failed login attempts (401 errors) from different IPs in 60 seconds | Rate limit the endpoint and trigger MFA challenge |
| Malware upload | File with double extension (e.g., .pdf.exe) or known malicious hash | Quarantine file and scan with sandbox |
| Unauthorized share link access | Repeated 403 errors from anonymous IPs to a single file | Revoke share link and audit permissions |
| Geographic anomaly | Request from a country where your team has no presence | Flag for manual review |
Building a Real-Time Detection Pipeline
Let us walk through a practical setup. Assume you use AWS S3 and want to detect data exfiltration.
- Enable S3 access logs and send them to a dedicated logging bucket.
- Set up a Lambda function that triggers on each new log file. Parse the log and extract the requester’s IP, user agent, and requested file.
- Store a sliding window of recent activity per user in a Redis cache. For each new request, count how many files that user has accessed in the last 5 minutes.
- If the count exceeds a threshold (say 50 files), publish an alert to a Slack channel or PagerDuty.
- Automate a response: Use an S3 bucket policy to temporarily block the user’s IP, or invalidate their session token.
This same pipeline can be adapted for Google Drive and Dropbox by swapping the log source and API calls.
Common Mistakes to Avoid
Even the best setup can fail if you overlook these pitfalls.
- Ignoring false positives: A developer running a build script might look like an attacker. Whitelist known service accounts and CI/CD pipelines.
- Not rotating log storage: Logs grow fast. Set retention policies and archive older logs to cold storage to control costs.
- Forgetting about internal threats: Not all bad actors come from outside. Monitor for internal users accessing files outside their normal scope.
- Overlooking encrypted traffic: If you use HTTPS, your logs still show the request path and status code. Do not skip TLS inspection if your compliance allows it.
Tools and Techniques for Scanning Logs
When you need to manually scan logs or build ad hoc queries, use these approaches.
- Grep for known patterns: Search for file extensions like .exe, .bat, or .vbs in unexpected directories.
- Use jq for JSON logs: If your logs are in JSON format, jq lets you filter and aggregate on the command line.
- Set up dashboards in Kibana or Grafana: Visualize request volume per user, top files accessed, and geographic heatmaps.
- Write scheduled SQL queries: If you store logs in a database, run queries that compare today’s access patterns to a 7-day rolling average.
Putting It All Together
Access logs are not just for troubleshooting. They are a live feed of trust and risk. Every request is a data point that either confirms normal behavior or screams for attention. By streaming those logs, applying real-time rules, and acting on alerts, you move from reactive security to proactive defense.
Start small. Pick one threat pattern from the table above and build a single alert for it. Once that runs smoothly, add the next. Over time, you will build a system that catches the subtle signs of compromise before they turn into headlines.
For a deeper look at how to harden your entire file hosting setup, check out our guide on top strategies for securing your cloud storage data. And if you are evaluating different platforms, our ultimate guide to choosing the best cloud storage for digital files can help you pick one with strong native logging capabilities.
Keep Watching the Logs
Security is not a one-time setup. It is a habit. Make it part of your weekly routine to review your alert thresholds, update your IP blacklists, and test your pipeline with a simulated attack. The moment you stop paying attention to your access logs is the moment an attacker finds their way in. Stay curious, stay vigilant, and keep those logs streaming.